Showing posts with label stats. Show all posts
Showing posts with label stats. Show all posts
Monday, August 10, 2015
Who Are These Guys?
Player A: .159 BA, .196 OBP, .227 SLG, 88 AB/HR, 17 wRC+
Player B: .285 BA, .386 OBP, .512 SLG, 18 AB/HR, 153 wRC+ (100 is league average)
Player C: 57 1/3 inn, 1.57 ERA, 10.0 K/BB
Player D: 41 1/3 inn, 5.01 ERA, 2.9 K/BB
Thursday, January 16, 2014
What the Heck Happened?
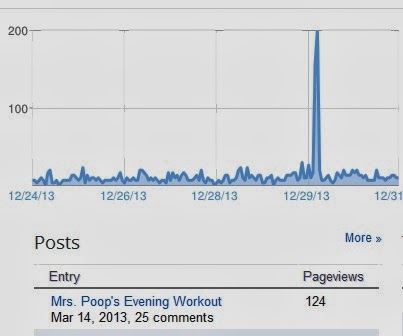
One day I noticed an unusual spike in hits for the Poop.
 Most of them were for the post titled "Mrs. Poop's Evening Workout." That was the post speculating about Undercover Boss coming to Retro Fitness, which did eventually happen.
As you may remember, that episode featured a horrible employee named Jackie who was fired for her behavior on the show.
I am guessing that episode recently aired for the first time in New Zealand.
Most of them were for the post titled "Mrs. Poop's Evening Workout." That was the post speculating about Undercover Boss coming to Retro Fitness, which did eventually happen.
As you may remember, that episode featured a horrible employee named Jackie who was fired for her behavior on the show.
I am guessing that episode recently aired for the first time in New Zealand.
 Note: that original post has 25 comments (most all-time) and 3400 page views (just outside the top 10 all-time).

Friday, November 01, 2013
Who Are These Guys
Player A: 73 1/3 inn 48 sv 0.61 ERA 1.34 FIP 603 ERA+ 8.96 K/9 0.49 BB/9 .213 BABIP 3.1 WAR
Player B: 70 2/3 inn 39 sv 1.40 ERA 2.03 FIP 316 ERA+ 9.81 K/9 0.76 BB/9 .218 BABIP 3.3 WAR
Player C: 74 1/2 inn 21 sv 1.09 ERA 1.61 FIP 376 ERA+ 12.23 K/9 1.09 BB/9 .188 BABIP 3.3 WAR
Notes: 1) Numbers are all jumbled, but its easier if you read it as columns, than straight across. 2) I use Fangraphs WAR, other calculations differ slightly. 3) These are from 3 different seasons.
Tuesday, June 18, 2013
Who Should Go?
Zack Wheeler will make his first major league start today which will force one pitcher from the rotation. Matt Harvey, Dillon Gee and Jon Niese have their spots wrapped up, so it comes down to Shaun Marcum vs. Jeremy Hefner.
By traditional measures you would think Marcum should be demoted to the bullpen or the minors because of his 5.43 ERA, his 0-8 record and his poor performance in his last start against the Cubs, when he could have been said to be fighting to keep his spot.
Meanwhile Hefner while nearly as bad in won-loss record at 1-6, his ERA is 3.96, and he gave up only 1 earned run in each of his last three starts. So clearly Hefner deserves to stay right? Wrong!
Here's why: Marcum's WAR is 1.4 (and he missed at least 4 early season starts), while Hefner is only 0.2, barely above replacement level.
I know some of you distrust WAR, but there are some very good reasons WAR is telling us what it is.
There are 2 main things a pitcher has total control over, strikeouts and walks.
Strikeouts per 9 innings:
Marcum 7.74
Hefner 6.72
Walks per 9 innings:
Marcum 1.81
Hefner 2.76
So Marcum strikes out an extra batter per 9, and walks one fewer. It's those pesky things he can't control that are hurting him.
BABIP (batting average on balls in play)
Marcum .329
Hefner .271
So the Mets defense is turning batted balls into outs at a much higher rate for Hefner than they are with Marcum, which causes this:
FIP (Fielding-Independent Pitching)
Marcum 3.06
Hefner 4.69
So basically, because Marcum strikes out more batters, walks fewer and has been victimized by bad defense, his ERA should be close to 3, not five and a half.
Eventually you would expect those things to normalize which means Marcum is more promising for the last three months than Hefner. Especially if you consider that Marcum had four horrible starts to being the season after his injury, and has improved since.
Also throw in the fact that Hefner would likely be a more effective reliever, and Marcum would be more likely trade bait, it's almost a no-brainer to keep Marcum in the rotation and to demote Hefner to the bullpen.
Saturday, January 26, 2013
Bourn To Run
I can’t believe I have to keep doing this (and maybe I don’t since most, if not all readers of this blog are on board) but it seems the dumb faction of Mets fans (Yankees fans in the wrong colors) are agitating for the Mets to sign Michael Bourn.
Bourn turned down $13m this year to stay with the Braves, so he’ll probably hope to get even more than that per year for a deal of 3 or 4 years.
Bourn is 30 and not even a particularly good player. He is below average offensively. His OPS+ for the last two years was 85 and 99 (100 is league average). He has zero power, and his on-base isn’t even good. He’s never been above .355 which is basically the minimum you could accept from a leadoff hitter.
If the Mets were so desperate for a leadoff hitter they should have kept Jose Reyes. He was a much better offensive player, at a more important position, though not as stellar defensively. His contract was for more years and slightly more money than what Bourn would probably get, but it would carry them to the same age 34 season. The Mets got only a 2nd round pick for Reyes (more on this in a moment). They made the right decision allowing Reyes to leave, now it's time to follow through on that plan.
I understand Bourn's WAR over the past 4 years (4.9, 4.7, 4.1 & 6.4) has been fantastic. Those numbers have been boosted by exceptional fielding and base-running numbers, which I acknowledge are important. But they can be very fickle, fluctuating wildly, and a move to a new park could incite a change in his defensive metrics. Though you would expect a speedy center fielder to be even better in a big park like CitiField.
Even if you could guarantee Bourn would add 5 wins to the Mets, and they could get 5 wins from other improvements (highly doubtful), that would still make the Mets an 84-win team, good enough for 3rd in the stacked NL East, at best. That's the complicating factor when analyzing the cost and value of wins on the open market. Wins that help a team improve from 70-something wins to the low-80s are of very little additional value. It's those wins that boost a team from the low and mid-80s into the playoffs that bring in additional millions.
Now remember another extenuating circumstance, the Mets would have to surrender their first round pick, the 11th overall in the draft as compensation for signing Bourn. This is a little tricky because the CBA states that for players in Bourn's class who were tendered by their teams the signing team would have to give up its highest pick as compensation, but the top 10 picks are protected. Technically, the Mets pick was 10th overall, but a pick was added because the Pirates didn't sign their pick, bumping the Mets down to #11, thus making it eligible to be forfeited for signing a player such as Bourn. The Mets have petitioned the league to get their pick protected because of this technicality, a challenge they are almost guaranteed to lose. But even if they do win, it would still be unwise.
Forget all the specifics, and look only at the broader picture: we have been here before, tried this strategy and it didn't work, it saddled the team with bad salaries and crippled us for years. Signing expensive free agents, especially ones who are barely above-average players (like Jason Bay) as they start to enter the age where their skills will decline, is a losing proposition. Yes, there's a strong chance the #11 draft pick will never play a single day in the major leagues, but as we have seen the teams that have built through the draft have built through the drafted have strong cores ready to contend for years. Teams that sign big-ticket free agents often end up struggling to get out from under those contracts for years, something I hoped the Mets were starting to get passed.
 Michael Bourn's excellent glove could add several wins for the Mets, but they'd still be a 4th place team
Thursday, November 15, 2012
It's Trout, No Doubt
The race for American League MVP between Miguel Cabrera and Mike Trout has become one of the most controversial in recent memory, odd since it really isn't even close, when you look at it the right way.
The common description of the race is old-school vs. new-school, the stat geeks vs. the baseball guys. But really it's common sense vs. faulty logic.
These are the main arguments for Miguel Cabrera:
He won the Triple Crown which hasn't been done since 1967. Miguel Cabrera hit 44 home runs in 161 games. Josh Hamilton hit 43 in 148 games. So if you give Cabrera the award just because he led the league in home runs, you're basically doing it because Josh Hamilton got hurt.
He led his team to the playoffs. Granted, Cabrera was hot down the stretch and Trout cooled off but all wins count the same in standings. But you also have to consider that the Tigers won 88 games and the Angels won 89. And Trout missed the first 20 games, and the Angels went 6-14. With Trout on the roster the Angels had a .585 winning percentage. With Cabrera the Tigers were .543. Add to that the fact that all the teams in Trout's division (Rangers, A's and Mariners) had better team ERAs than any team in Cabrera's division. So if you give Cabrera the award just because his team made the playoffs, you're basically doing it because the White Sox (and the Twins and Royals) suck.
Now that I have shot holes through the two biggest arguments in favor of Cabrera, let's look at the biggest thing Trout has going for him. The award is called Most Valuable Player. Not best hitter.
Defense: according to UZR, Trout saved the Angels 11 runs with defense. Cabrera cost his team 10. Would this race even be a race if Trout had 11 more homers, and Cabrera 10 fewer? No, and runs saved on defense are every bit as important as runs created at bat.
Base-running: Trout created 12 extra runs with his base-running thanks to his 49 steals (an 91% success rate) and Cabrera cost his team three runs.
The reason it comes down to little things like defense and base-running is because offensively they are so close. Cabrera has slight advantage in OPS, but Trout takes OPS+ because of park advantage. Both players are exactly tied in wRC+ (weighted runs created plus), also an adjusted number. Those are all very good measures of total offensive production.
Unlike RBI, which is frequently used to bolster Cabrera. Sure driving in runs is important, but runners need to be on base in order for that to happen.
This is not just a debate of stats vs. scouts. It's the right stats vs. the wrong stats. This is not about WAR, notice I didn't even mention it. It is about the things that WAR tells us. That these two players are very equal in offensive production. But in value (the other key word in MVP) they're not even close. Trout contributed more to his team in the field and on the bases, enough to overcome the slight, very slight, deficit in offensive production. And he did it all at a position that is much more valuable (harder to fill) than the one Cabrera played.
And that is why Mike Trout deserves to be the 2012 AL MVP.
Wednesday, November 07, 2012
Behind the Numbers
I love looking at exit polls to see which groups and topics that haven't gotten much attention are interesting.
First, the Jews: 69% to Obama, 30% for Romney. Jews make up only 2% of the entire vote.
93% of blacks voted for Obama. Down slightly from 2008. They were 13% of the total vote.
Gays made up 5% of the vote. More than twice as many gays as Jews. And I'm sure there were plenty of gay Jews. Anyway, 76% voted for Obama, 22% for Romney. That surprises me. Nearly one in four gay people went for Romney. That tells me two things: they are not single issue voters, and they realize that even if Obama says he thinks gay marriage should be legal, he hasn't addressed it in his policies for four years. So if neither candidate wants to make gay marriage legal, might as well find another issue to decide on.
Young people (under 30) voted for Obama by a 60 to 37 margin. Unmarried women went to Obama 67 to 31. If we're going to pay for their birth control I at least hope the sluts put out.
38% think Barack Obama is most to blame for the current economy. 53% say George W. Bush is most to blame.
18% of voters say their household contains a union member. And those voters went to Obama by a margin of 58-40. Surprised so many union households went to Romney actually
Here's the scariest number to me. 15% said response to Hurricane Sandy was the most important issue to them. Those voters went for Obama 73 to 26. I think the media, and Chris Christie may have given the President an assist there. While early response seemed to be good, FEMA predictably failed to provide strong assistance as the days wore on.
And the most upsetting number: only 60% of voters have a full-time job. The full-time jobbers were split 49-49. Those part-timers and unemployed went for Obama 53-45, giving some credence to the joke that Obama would be in the lead until Republicans got off of work.
Tuesday, June 19, 2012
The Truth Shall Set You Free
I found it nearly impossible to believe pre-season speculation saying that because R.A. Dickey unburdened himself of some personal demons in his book, he would start to pitch better. But something has certainly happened because is currently on the best streak of any starting pitcher in the history of baseball.
He is the first pitcher in 100 years at least to pitch two consecutive complete game 1-hitters, with 10 strikeouts or more in each.
Let's go back 6 starts:
6-0 - which matters because these games are unloseable
48 2/3 innings - out of 54 possible which is huge because bringing in your bullpen hurts you in the current game, and in games down the line
1 earned run - that translates into a 0.18 ERA
21 hits, 5 walks - 26 baserunners, that's a WHIP of .53
63 strikeouts - that's 11.65 Ks/9 innings. Those are power pitcher numbers.
A knuckleballer is not supposed to be able to do this. The knuckleball is supposed to be a fickle mistress who dances to her own whims. But Dickey has been remarkably consistent. If you remove his 8 runs in 4 1/3 innings in the rain in Atlanta, his ERA falls to a tiny 1.33.
Who knows if this can last. Chances are it won't. But this run he is on is truly historic. And it couldn't happen to a nicer guy. Nor one who deserves and appreciates his success more than Dickey.

Friday, May 04, 2012
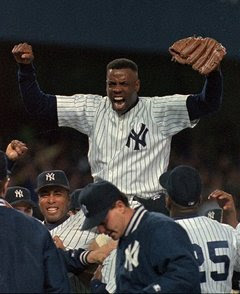
Oh No, No More Mo
Even as a Mets fan I am saddened by the injury to Mariano Rivera. He tore his ACL while shagging flies in the outfield during batting practice. At 42 years old and in the midst of what was likely his last season anyway, Rivera will likely never pitch in a Major League game again. In a crumpled heap on the warning track is how the career of the greatest relief pitcher ever ends.
 There isn’t even a debate as to whether Rivera is the best reliever ever. He has the most saves (608), the best ERA (2.21), the best FIP (min. 500 innings) and the best WAR (39) by far. He’s worth nearly 10 more wins over the course of his career than the second best guy, Goose Gossage. Only 9 relievers contributed even half as many wins over their careers as Rivera did.
But like I said that is a foregone conclusion. It’s more fun to compare him to starting pitchers. His WHIP is unbelievable, second only to Addie Joss. And that doesn’t include any kind of adjustment for era. His ERA stacks up well, but many dead-ball era pitchers like Christy Mathewson, Walter Johnson and Mordecai “Three Finger” Brown are better. Until you adjust ERA for era. The career leaders for ERA+ (which basically compares ERA to league average and adjust for park effects) is 206. Meaning his ERA was less than half of league average for his career. Pedro Martinez is second, with 154. That’s a pretty big gap between 1st and 2nd all time. When you look at his individual seasons on ERA+ the numbers are sick. 308 in 2005, 316 in 2008 and a bunch of other years in the mid and high 200s. To put this in perspective, 150 is really good, 200 is amazing. He is routinely above 200.
There isn’t even a debate as to whether Rivera is the best reliever ever. He has the most saves (608), the best ERA (2.21), the best FIP (min. 500 innings) and the best WAR (39) by far. He’s worth nearly 10 more wins over the course of his career than the second best guy, Goose Gossage. Only 9 relievers contributed even half as many wins over their careers as Rivera did.
But like I said that is a foregone conclusion. It’s more fun to compare him to starting pitchers. His WHIP is unbelievable, second only to Addie Joss. And that doesn’t include any kind of adjustment for era. His ERA stacks up well, but many dead-ball era pitchers like Christy Mathewson, Walter Johnson and Mordecai “Three Finger” Brown are better. Until you adjust ERA for era. The career leaders for ERA+ (which basically compares ERA to league average and adjust for park effects) is 206. Meaning his ERA was less than half of league average for his career. Pedro Martinez is second, with 154. That’s a pretty big gap between 1st and 2nd all time. When you look at his individual seasons on ERA+ the numbers are sick. 308 in 2005, 316 in 2008 and a bunch of other years in the mid and high 200s. To put this in perspective, 150 is really good, 200 is amazing. He is routinely above 200.
 And I haven’t even mentioned his postseason performance yet. He is arguably the great postseason performer of any player ever. 8-1 with 42 saves and 0.70 ERA in 141 innings. Against only the best teams. That is amazing. And all those great regular season numbers I just listed pale in comparison to his October greatness. Greatness we will likely never see again. Not from anyone else, and unfortunately not from Rivera himself either.


Sunday, March 11, 2012
Why RPI Matters
For several years I have been trying to educate you all on the importance of three little letters, in baseball, OPS. I think succeeded so now I will move on to college basketball where the three crucial letters are RPI.
Later today the brackets will be announced and RPI will be used to justify why teams got in or got left out.
RPI is simply a formula based on your winning percentage, your opponents' winning percentage and your opponents' opponents' winning percentage. With 345 teams playing such disparate schedules, RPI helps compare teams with vastly different records and vastly different schedule strengths.
Note: there are major flaws in the SOS (strength of schedule) numbers making them somewhat unreliable. For instance, if one team were to play #1 and #345 in RPI and another team played say, #50 and #51, the team that played #1 would still have a weaker schedule. Though the odds of going 2-0 against that pair are much lower. Maybe I will expand on the flaws of SOS another time.
Let me give you an example of what RPI can tell us:
On Christmas Day Tulane was 9-2 and Long Beach State was 5-6. Tulane's SOS was 342 (even though they had played #1 Syracuse) and Long Beach State's SOS was 1.
Tulane's RPI was roughly 150 and Long Beach was 10 or 11 (wish I had recorded these numbers that day.)
Old school basketball watchers and the idiots who vote in the polls might say clearly a team with 9 wins ins better than a team with 5. No way can they be 140 spots better.
But Tulane wins were against teams like Navy, Maryland Eastern Shore, Alabama A&M and Alcorn State. All of which have RPIs (final numbers) higher than 300.
Compare that to Long Beach State which lost to San Diego St, Louisville, Kansas, North Carolina and Kansas State. All of those are in the top 50, 4 in the top 25.
But RPI is not just useful for what it tells us about the past, it also predicts the future.
After the 5-6 start LBSU went 19-2, with one of the losses against another top 25 team, Creighton.

Meanwhile, Tulane went 4-14 after that hot start.
So maybe it was predictable that Tulane would end the season with an RPI of 249, while Long Beach State finished 39th, got a 12 seed in the tournament with a decent chance to upset New Mexico in the first round.
Monday, February 20, 2012
Lin Can Last
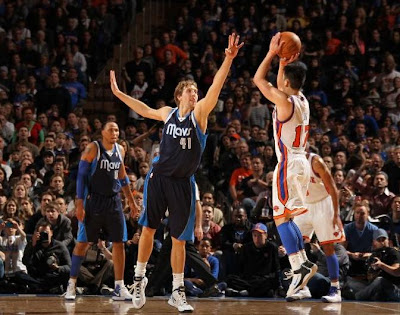
I’ve been accused of pouring water on Lin-Sanity because of my post last week pointing out holes in Jeremy Lin’s game that could eventually lead to the deflation of the Lin bubble. While that wasn’t my intent (as always, it was to provide fair and balanced, hype-free analysis), I understand how it came off and want to now assert my true feelings about Lin-sanity:
I FUCKIN LOVE IT
It’s been at 10 years since I’ve been this excited about the Knicks. As I’ve gotten older and married and had kids, I have sacrificed the Knicks. There have been some years where I barely even watch Knicks games. But since Jeremy Lin has emerged the Knicks have become my favorite team. I have seen almost every game in its entirety. That’s doesn’t make me a front-runner since I’ve kind of been there all along.
As the Knicks have lost 2 of their last 3 games some people are now expecting the Lin Train to fall off the tracks, but I’m not among them. Here’s why:
Lin is smart. He knows how to play the game. As he gains more experience he will better be able to differentiate the chances he should take and those he shouldn’t.
Which leads me to turnovers, which many people feel will be his undoing, I don’t.
His turnover rate is high, but not unreasonably so, lower than Steve Nash and Rajon Rondo. And his usage rate is high, higher than most point guards who dribble upcourt, pass the ball and get out of the way. Given his involvement in the offense, his rate of turnovers, while problematic, is not fatal.
Also, Lin gives away fewer possessions with bad shots than most guards do. He’s basically shooting 50% from the field. And here’s my favorite thing about him, his judicious use of the three-pointer. He knows it’s not a strength, so he only shoots when he’s open. And he’s made 11 of 24 in the past 7 games.
This is the perfect system for him. D’Antoni needs a dynamic point guard to run his offense and Lin is it.
He has good running mates. Both Stoudemire and Anthony are good mid-range jump shooters who can play pick and pop with him. Chandler and Fields are unselfish players who don’t need the ball to be able to contribute.
For all these reasons I am hopeful Jeremy Lin will have a long and successful career as the Knicks point guard.
I’m not yet optimistic enough to predict a championship, but don’t accuse me of being a killjoy, because like I said earlier, I FUCKIN LOVE LINSANITY!
I FUCKIN LOVE IT
It’s been at 10 years since I’ve been this excited about the Knicks. As I’ve gotten older and married and had kids, I have sacrificed the Knicks. There have been some years where I barely even watch Knicks games. But since Jeremy Lin has emerged the Knicks have become my favorite team. I have seen almost every game in its entirety. That’s doesn’t make me a front-runner since I’ve kind of been there all along.
As the Knicks have lost 2 of their last 3 games some people are now expecting the Lin Train to fall off the tracks, but I’m not among them. Here’s why:
Lin is smart. He knows how to play the game. As he gains more experience he will better be able to differentiate the chances he should take and those he shouldn’t.
Which leads me to turnovers, which many people feel will be his undoing, I don’t.
His turnover rate is high, but not unreasonably so, lower than Steve Nash and Rajon Rondo. And his usage rate is high, higher than most point guards who dribble upcourt, pass the ball and get out of the way. Given his involvement in the offense, his rate of turnovers, while problematic, is not fatal.
Also, Lin gives away fewer possessions with bad shots than most guards do. He’s basically shooting 50% from the field. And here’s my favorite thing about him, his judicious use of the three-pointer. He knows it’s not a strength, so he only shoots when he’s open. And he’s made 11 of 24 in the past 7 games.

This is the perfect system for him. D’Antoni needs a dynamic point guard to run his offense and Lin is it.
He has good running mates. Both Stoudemire and Anthony are good mid-range jump shooters who can play pick and pop with him. Chandler and Fields are unselfish players who don’t need the ball to be able to contribute.
For all these reasons I am hopeful Jeremy Lin will have a long and successful career as the Knicks point guard.
I’m not yet optimistic enough to predict a championship, but don’t accuse me of being a killjoy, because like I said earlier, I FUCKIN LOVE LINSANITY!
Thursday, February 09, 2012
In the Zone
For years the old school baseball fans and media have decried defensive statistics, saying you can’t judge defense with numbers. Well you can, if the numbers are derived from watching and analyzing every single play in every single game, which is what statistics like Range Factor and Ultimate Zone Rating do. And now similar metrics have been applied to basketball.
Please read this amazing article from Sports Illustrated’s Luke Winn. He charted every play of Syracuse’s first 11 conference games (before Georgetown) and 4 non-conference games. The results are fascinating and I will encapsulate them here for those too lazy to read the whole thing.
Fab Melo is a great defender. Not only does he block shots and grab rebounds, he takes a lot of charges, three times as many as anyone else on the team. This creates turnovers at a higher rate than most big men. Baye Keita is a big drop-off when Melo is not in the game, because he fouls a lot. But the biggest reason SU struggled without Melo is because of Rakeem Christmas, who is the worst defender on the team.
Kris Jospeh is the best of the forwards defensively, he does everything well, challenge shots, force turnovers, but he’s not a good rebounder. This has been a huge problem against bigger opponents, and a lot of the responsibility to fix it is on Kris Joseph. James Southerland is a better defender than you might think, but he fouls too much. CJ is just Fair.
Dion Waiters is the best of the guards, by a wide margin. He forces more turnovers and challenges more shots, resulting in a lower shooting percentage against than Triche, and especially compared to Jardine. Opponents are almost twice as likely to make a shot against Scoop as against Waiters. And Scoop almost never fouls the shooter, because he doesn’t get out on open shooters.
Thursday, November 03, 2011
Hall of Famer Dan Uggla
Despite one of the worst starts to a season anyone has ever had (568 OPS through July 4th) Braves second baseman Dan Uggla is still on his path for Cooperstown.
Here's where I originally suggested Uggla's homers and RBI from a second baseman could be good enough to make the Hall of Fame.
This season Uggla hit 36 home runs (a career high), giving him at least 30 for the fifth straight season. No other second baseman in major league history has reached 30 homers more than three times overall.
Through 6 seasons he has 192, meaning he could easily have 400 after 14 or 15 years. He only needs 352 to be the all-time leader among second baseman.

Thursday, May 26, 2011
Mets Update
Since we last spoke about Fred Wilpon's comments in the New Yorker, there has been a major development. Hedge fund manager David Einhorn bought 49% of the Mets for $200m.
This solves any short-term liquidity crisis the Mets may have had and it tells us who the likely next owner would be if the Wilpons were forced to or chose to sell their remaining stake.
I don't think it means the Mets as a team are worth only $400m. The Wilpons refused to give up control of the team and very few powerful billionaires would be willing to fork over hundreds of millions of dollars without getting say in how that money was spent.
But that's exactly what Einhorn did because he is a lifelong Mets fan. That could be good or bad. If he someday becomes the principal owner and runs the team like a fan he could run it like a rational fan (desperate to win, but willing to be patient and build an organization the right way) or a crazy WFAN caller (buy free agents, trade every prospect) which as we have seen doesn't work for anyone other than the Yankees.
Most likely though the Wilpons will reach a settlement for $300m - $400m in the Madoff case and still have enough money left over to keep running the Mets.
Separately, a brilliant Wall Street Journal article analyzes the Beltran signing and agrees with my assessment: it was a good deal at the time, it didn't work out as well as hoped because of injuries and the bad team around him, but it was still worth it. Comparing Beltran's value to the average cost in the free agent market that season, the Mets got their money's worth on Beltran, according to the article.
One more thing, poker watching Mets fans may remember Einhorn from the 2006 World Series of Poker Main Event. He finished 18th, good for $660k. And he wore a sweatshirt with kids' handprints on it for some kind of charity.

Thursday, May 19, 2011
If It Weren't For Bad Luck We'd Have No Luck At All
Justin Verlander recently pitched the second no-hitter of his career. While watching the celebration after that game Mrs. Poop seemed amazed that one pitcher could have two no-hitters, while an entire franchise, the Mets, never had one in 50 years.
Here is a Wall Street Journal article (from last season) by Carl Bialik (the first person references are his not mine) explaining the phenomenon:
In 1962, the New York Mets and the Houston Colt .45s (now the Astros) entered the National League. Seven years later, the San Diego Padres joined the NL, along with the Montreal Expos (now the Washington Nationals), while the AL added the Kansas City Royals and Seattle Pilots (now the Milwaukee Brewers). Since then, six more teams have joined the majors, most recently Arizona and Tampa Bay. After Matt Garza threw a no-hitter for the Tampa Bay Rays last season, every current major-league team has at least one no-hitter — except the Padres and Mets, beaten to the feat by at least six teams younger than them.
The Mets’ futility has been oft-lamented by their fans, and even has inspired a website (nonohitters.com which exists only to chronicle the hit that breaks up the Mets pitcher's no-hitter each night) all about the drought. (A drought which this Mets fan prefers to, say, a title drought such as the one experienced by fans of that other member of the class of ‘62, the Astros.) Padres’ pitchers inability to go a full game without yielding a hit also is surprising, since the team’s strength often has been its pitching.

Just how unlucky have the Mets and Padres been? To answer the question, I developed a simplistic statistical framework to estimate the probability that a team would get a no-hitter in any particular game. For any given team, I compiled for each season of its history the number of games it played, the number of innings pitched (IP) and hits allowed. There are three outs in an inning, so the probability, on average, that any one batter makes an out is roughly equal to three times IP divided by three times IP plus hits allowed (events other than outs or hits are disregarded because they neither break up a no-hitter nor otherwise affect its probability — at least not in an obvious way). A no-hitter over nine innings requires 27 straight outs without a hit, so its probability is the probability that any one hitter makes an out, raised to the 27th power.
Then the probability that a team doesn’t get a no-hitter in a given season is one minus the probability in any single game, raised to the power of the number of games in that season. And the probability that it never has a no-hitter is the product of each of those probabilities of no no-hitters in each season.
This is, again, simplistic. The biggest problem is that the probability that a given batter makes an out will vary from game to game, and within games. This could mean that the statistical approach outlined above underestimates the probability of a no-hitter, because it fails to account for a hot pitcher meeting a cold team in propitious stadium and weather conditions. Also it fails to account for postseason no-hitters (though there’s been only two in major-league history: Don Larsen’s perfect game in the 1956 World Series and Roy Halladay's no-hitter last season).
But it does surprisingly well despite such caveats. Applied to the New York Yankees, it predicts 9.76 regular-season no-hitters over their 110-year history. The Yankees have had 10 no-hitters in the regular season. Also, I applied it even more simplistically to major-league baseball as a whole, using just three numbers: The number of games, innings pitched and hits allowed in history. That yielded an expected total of 161 no-hitters. In reality, there have been 237, counting Larsen’s and Halladay's — so not far off.
So, back to the original question: How unlucky have the Mets and Padres been? There’s just a 3.9% probability that San Diego wouldn’t have gotten a no-hitter in its 42-year history, based on its pitching staff’s stats. And the Mets have been even unluckier — the chance of no no-hitter in their 49 seasons is 0.93%.
In the Mets’ case, at least, it doesn’t appear to be for lack of good chances. The team has had 34 one-hitters in its history — compared to an expected total of 41, using a similar approach to the one used to calculate expected no-hitters.
The bad news for the Mets is that their best chances may be behind them. The franchise’s best 14 seasons in terms of hits allowed per inning all were 20 or more years ago.
The above article is a great example of the strength and weakness of the modern age of statistical analysis. Everything that can't be measured is ascribed to luck. And in most cases when things that should happen don't, it is because of simple chance. But as the case with clutch hitting, human factors are often discounted. I don't think that's the case here, it's unlikely that say for instance a Mets pitcher carrying a no-hitter into the later innings would be more likely to get adversely affected by nerves because of his desire to break the team's string of no-hitterless years than a pitcher on another team that has had a no-hitter more recently.
But it does discount two important factors:
1) Papa Poop has called me during every near no-hitter in recent Mets history in an effort to prove that he is unable to jinx a no-hitter by calling me. So far he is failing.
2) The Mets are a jinxed, cursed organization. Though we do have two titles in 50 years (roughly in line with expected value were the conditions for success in major league baseball more even) Mets fans have also suffered through many heartbreaks, including the nightly one when the opposing team inevitably gets its first hit.
But someday that streak will end, I hope. And as Mets fans we still have hope, maybe that's all we have.
Here is a Wall Street Journal article (from last season) by Carl Bialik (the first person references are his not mine) explaining the phenomenon:
In 1962, the New York Mets and the Houston Colt .45s (now the Astros) entered the National League. Seven years later, the San Diego Padres joined the NL, along with the Montreal Expos (now the Washington Nationals), while the AL added the Kansas City Royals and Seattle Pilots (now the Milwaukee Brewers). Since then, six more teams have joined the majors, most recently Arizona and Tampa Bay. After Matt Garza threw a no-hitter for the Tampa Bay Rays last season, every current major-league team has at least one no-hitter — except the Padres and Mets, beaten to the feat by at least six teams younger than them.
The Mets’ futility has been oft-lamented by their fans, and even has inspired a website (nonohitters.com which exists only to chronicle the hit that breaks up the Mets pitcher's no-hitter each night) all about the drought. (A drought which this Mets fan prefers to, say, a title drought such as the one experienced by fans of that other member of the class of ‘62, the Astros.) Padres’ pitchers inability to go a full game without yielding a hit also is surprising, since the team’s strength often has been its pitching.

Just how unlucky have the Mets and Padres been? To answer the question, I developed a simplistic statistical framework to estimate the probability that a team would get a no-hitter in any particular game. For any given team, I compiled for each season of its history the number of games it played, the number of innings pitched (IP) and hits allowed. There are three outs in an inning, so the probability, on average, that any one batter makes an out is roughly equal to three times IP divided by three times IP plus hits allowed (events other than outs or hits are disregarded because they neither break up a no-hitter nor otherwise affect its probability — at least not in an obvious way). A no-hitter over nine innings requires 27 straight outs without a hit, so its probability is the probability that any one hitter makes an out, raised to the 27th power.
Then the probability that a team doesn’t get a no-hitter in a given season is one minus the probability in any single game, raised to the power of the number of games in that season. And the probability that it never has a no-hitter is the product of each of those probabilities of no no-hitters in each season.
This is, again, simplistic. The biggest problem is that the probability that a given batter makes an out will vary from game to game, and within games. This could mean that the statistical approach outlined above underestimates the probability of a no-hitter, because it fails to account for a hot pitcher meeting a cold team in propitious stadium and weather conditions. Also it fails to account for postseason no-hitters (though there’s been only two in major-league history: Don Larsen’s perfect game in the 1956 World Series and Roy Halladay's no-hitter last season).

But it does surprisingly well despite such caveats. Applied to the New York Yankees, it predicts 9.76 regular-season no-hitters over their 110-year history. The Yankees have had 10 no-hitters in the regular season. Also, I applied it even more simplistically to major-league baseball as a whole, using just three numbers: The number of games, innings pitched and hits allowed in history. That yielded an expected total of 161 no-hitters. In reality, there have been 237, counting Larsen’s and Halladay's — so not far off.
So, back to the original question: How unlucky have the Mets and Padres been? There’s just a 3.9% probability that San Diego wouldn’t have gotten a no-hitter in its 42-year history, based on its pitching staff’s stats. And the Mets have been even unluckier — the chance of no no-hitter in their 49 seasons is 0.93%.
In the Mets’ case, at least, it doesn’t appear to be for lack of good chances. The team has had 34 one-hitters in its history — compared to an expected total of 41, using a similar approach to the one used to calculate expected no-hitters.
The bad news for the Mets is that their best chances may be behind them. The franchise’s best 14 seasons in terms of hits allowed per inning all were 20 or more years ago.

The above article is a great example of the strength and weakness of the modern age of statistical analysis. Everything that can't be measured is ascribed to luck. And in most cases when things that should happen don't, it is because of simple chance. But as the case with clutch hitting, human factors are often discounted. I don't think that's the case here, it's unlikely that say for instance a Mets pitcher carrying a no-hitter into the later innings would be more likely to get adversely affected by nerves because of his desire to break the team's string of no-hitterless years than a pitcher on another team that has had a no-hitter more recently.
But it does discount two important factors:
1) Papa Poop has called me during every near no-hitter in recent Mets history in an effort to prove that he is unable to jinx a no-hitter by calling me. So far he is failing.
2) The Mets are a jinxed, cursed organization. Though we do have two titles in 50 years (roughly in line with expected value were the conditions for success in major league baseball more even) Mets fans have also suffered through many heartbreaks, including the nightly one when the opposing team inevitably gets its first hit.
But someday that streak will end, I hope. And as Mets fans we still have hope, maybe that's all we have.
Friday, May 06, 2011
Why OPS is So Important
I've spent several years trying to explain to anyone who would listen why OPS is the best stat to use to evaluate baseball players.
Batting average is still the standard but it's terrible. Here's why: walks count. And doubles count more than singles, but less than triples, and even less than home runs.
Three examples from the early part of this season:
Player A: .250 BA (30-120), 5 homers, 16 RBI, 18 walks
Player B: .342 BA (25-73), 0 homers, 8 RBI, 3 walks
Player C: .189 BA (17-90), 6 homers, 17 RBI, 22 walks
Judging by just batting average you would say the guy hitting .342 is the best. But in truth he has no power and never walks. I would actually take Player C because he has the best power and the most walks.
But the point is all three of these players are essentially equal according to OPS:
David Wright 778 OPS
Erick Aybar 789 OPS
Jonny Gomes 786 OPS
So new statistical analysis doesn't just help you determine who is better, it helps you figure out who is equal but looks much better (or worse).
Tuesday, October 19, 2010
A Mike Scott Situation
In the 1986 NLCS the Mets won games 2, 3 and 5 by beating Nolan Ryan and Bob Knepper. They lost Games 1 and 4 against Mike Scott. So in Game 6 when the Mets were losing 3-0, their thoughts must have turned to this: if we lose hear, we have to face Mike Scott in Game 6. Perhaps motivated by that fear the Mets scored 3 in the 9th to tie and eventually won in the 16th, making Mike Scott a helpless bystander as the Mets moved on to the World Series.
The Yankees now face a similar quandary for 3 straight games. If the Yankees lose even one more game they guarantee themselves a date with Cliff Lee in Game 7.

Through 8 postseason starts Lee is building the best postseason resume of any starting pitcher ever (the Lee-Rivera debate is unsolvable).
Cliff Lee: 8 GS 3 CG 7 W 0 L 1.26 ERA 67 Ks 64 1/3 innings
Sandy Koufax: 8 GS 4 CG 2 SHO 4 W 3 L 0.95 ERA 61 Ks 57 innings
Bob Gibson: 9 GS 8 CG 2 SHO 7 W 2 L 1.89 ERA 92 Ks 81 innings
A couple of caveats. All of Gibson and Koufax's starts were World Series games. But Lee is playing in an era much more weighted towards the hitter. So I think that even things out pretty well.
Lee can pad his postseason resume in a Game 7 against the Yankees, but I know the Yankees are hoping they can win before it comes to that.
Thursday, August 26, 2010
The Bags are Juiced, The Mets Obviously Aren't
I don’t mean to ignore the severe mismanagement of the Mets which has led to their downward spiral from the precipice of the World Series in 2006 to the disastrous outfit we see before us today. The Mets have an incredibly flawed organizational philosophy which focuses on acquiring expensive overrated veterans while failing to develop cheap, young talent.
All of that is true, but another major factor is causing the Mets to be terrible. It’s impossible to explain so I think many advanced sabremetricians would call it luck. I don’t know what to call it but I think the main reason the Mets are so bad is because of a lack of timely hitting.
Let’s just look at the bases loaded. This year the Mets are 20 for 101 (.198) with the bases loaded. That’s worst in the majors. They have zero grand slams (worst in the majors). And they’ve allowed 9 grand slams (most in the majors), but that’s another issue.
If the Mets were only marginally better, say 2 grand slams hit, 2 fewer allowed they could be 4 games better in the standings and right in the wild card race.
But they’re not – and why?
Maybe they’re trying too hard, in those situations, or not hard enough. Maybe it is just luck. Maybe the Mets aren’t clutch, whatever that means. But the numbers are indisputable.
Here are the Mets OPS numbers with the bases loaded for the last 5 years and the major league rank:
2010: .483 (30th)
2009: .598 (28th)
2008: .637 (27th)
2007: .676 (25th)
2006: .976 (4th)
Tuesday, June 29, 2010
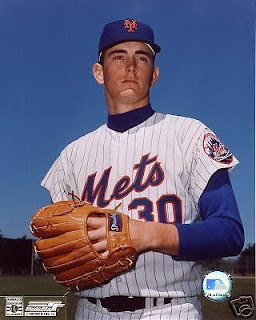
U.R.A. Dickey
Last night's subpar performance against the Marlins may be the beginning of the end for knuckleballer R.A. Dickey.
Through 7 starts Dickey was unbelievable, going 6-0 with a 2.33 ERA. But there's a reason Dickey is a journeyman. Unless he really did figure out his knuckleball and can turn into a Tim Wakefield-type (overall reliable with bad starts sprinkled in), I expect him to regress to his prior level of performance.
His out-of-nowhere mastery reminded me of 2007, when Jorge Sosa (admittedly different because he's not a knuckleballer) went 6-1 with a 2.62 ERA in his first 7 starts for the Mets. Sosa went 1-5 with a 7.00 ERA in his next 7 starts and was demoted to the bullpen.
I fear a similar fate may await Dickey.

Friday, April 30, 2010
Who Should be the National League Pitcher of the Month for April?
I can never remember a season in which so many pitchers have started off the season so well and that will mean a hotly contested NL Pitcher of the Month Award for April. The candidates:
Roy Halladay: 4-1, 1.80 ERA, 40 innings, 36 hits, 3 BB, 33 Ks, 1.6 WAR
Special Consideration Stat: 2 CG and 1 SHO
Mike Pelfrey: 4-0, 0.69 ERA, 25 innings, 18 hits, 13 BB, 19 Ks, 0.7 WAR
Special Consideration Stat: 1 Save
Ubaldo Jimenez: 5-0, 0.79 ERA, 34 1/3 innings, 22 hits, 14 BB, 31 Ks, 1.3 WAR
Special Consideration Stat: No-hitter
Tim Lincecum: 4-0, 1.27 ERA, 35 1/3 innings, 22 hits, 7 BB, 43 Ks, 1.5 WAR
Special Consideration Stat: 2.01 Fielding-Independent Pitching, lower than the other three guys
I'm voting for You-Baldo because he's giving up fewer runs and a no-hitter is pretty special. But Lincecum should probably be the choice of the sabremetricians considering he'd be 5-0, with a lower ERA if his bullpen hadn't blown it.
Subscribe to:
Posts (Atom)